How to Find the Root Cause of Latency and Errors
Your HTTP monitor fires an alert — response times spiked or you're getting 502 / 504 errors.
This guide walks through a systematic, step-by-step process to isolate the root cause using Oack's rich HTTP telemetry — with minimum effort and maximum precision.
What you'll use
- HTTP timing breakdown — 6-phase request waterfall (DNS, Connect, TLS, Send, Wait, Receive). See HTTP Monitoring.
- TCP telemetry — Kernel-level TCP_INFO metrics (RTT, retransmits, congestion window). See TCP Telemetry.
- Performance Percentiles — Per-fraction percentile ranks across 1d / 7d / 30d / 90d windows. See Performance Percentiles.
- Server-Timing headers — Upstream timing from CDN, load balancer, and application.
- CDN enrichment — Cloudflare edge logs, PoP location, and cache status. See CDN Enrichment.
- Traceroute & CDN GEO — Network path and CDN edge PoP comparison on the probe detail popup.
The request path
This is a simple request pipeline — typical for a small team running a straightforward web service — but it's familiar and illustrative. Each layer can introduce latency, errors, or both, and each provides its own observability signals.
The goal is to narrow down which segment of this path is causing the problem — then act on the right layer instead of guessing. The SLB (Server Load Balancer) sits at the center and acts as the pivot point: its logs tell you whether the problem is to its left (network/CDN) or to its right (app/database).
Step 1 — Open the Probe Detail
When an alert fires (latency spike, 502, or 504), open the failing probe in the Oack dashboard.
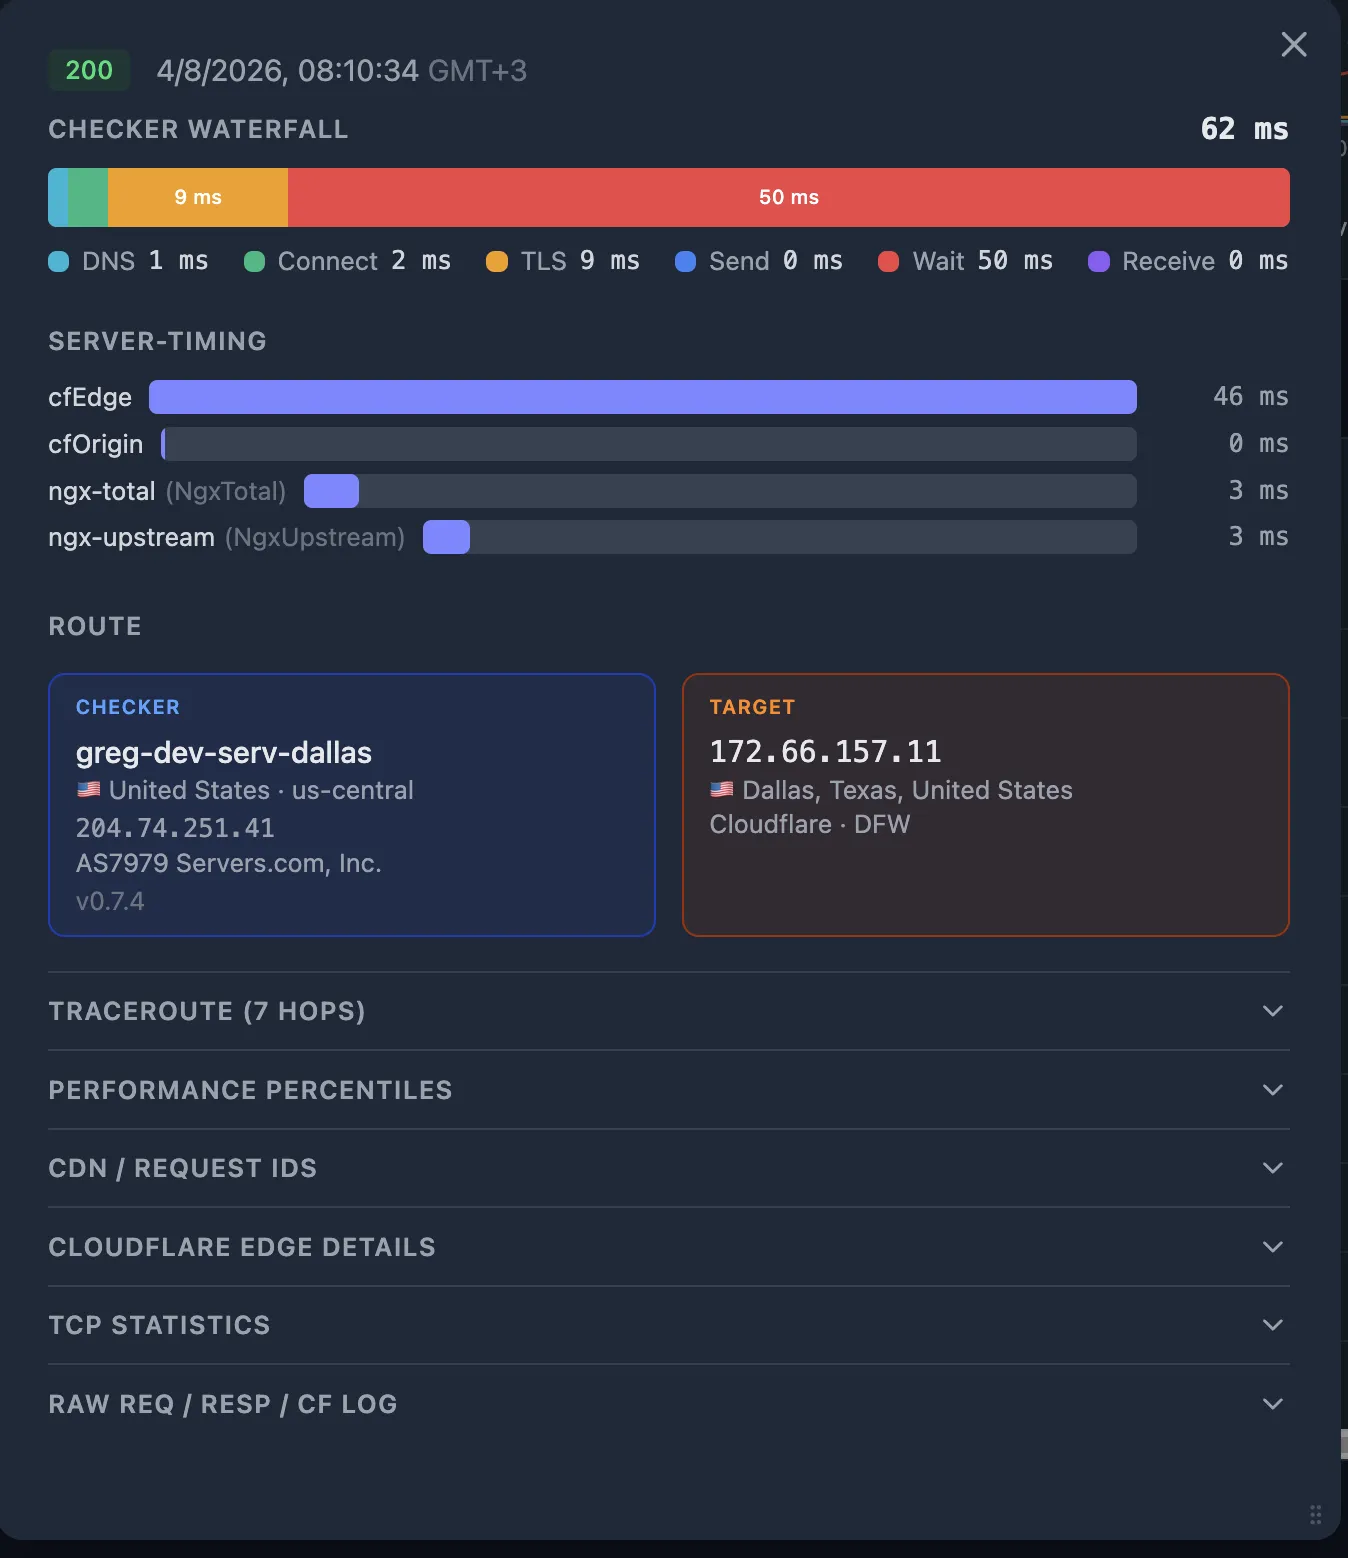
If you're using Oack, this is a shortcut — the probe detail popup consolidates all the telemetry you need in one place.
We'll go through each of these data sources in detail in the following steps:
- Request Waterfall — visual breakdown of DNS, Connect, TLS, Send, Wait, Receive.
- Server-Timing bars — upstream durations extracted from Server-Timing response headers.
- Performance Percentiles — per-fraction percentile ranks across 1d / 7d / 30d / 90d windows.
- TCP Statistics — RTT, retransmits, congestion window, RTO.
- Traceroute — network path from the checker to the target.
- CDN GEO — which CDN edge PoP (Point of Presence) served the request.

Step 2 — Check the SLB Logs: Go Left or Right?
This is the best starting point — especially if you don't have rich observability set up yet and aren't using an external monitoring tool. The SLB (Nginx / HAProxy / ALB) is your pivot point. Its access logs record two critical values:
| Nginx variable | What it measures | Where to find it |
|---|---|---|
$request_time | Total time from first client byte to last byte sent back | Nginx access log (evaluated after connection close) |
$upstream_response_time | Time the SLB waited for the upstream (App) to respond | Nginx access log or Server-Timing header |
Keep in mind that $request_time includes everything the SLB deals with beyond the upstream: slow clients sending or receiving data, TLS handshake time, and CDN-to-origin routing overhead.
If $request_time is dramatically larger than $upstream_response_time, the root cause is on the left side of the diagram — it's about how clients are reaching you and how performant that connection is, not about how you handle the request on the right side.
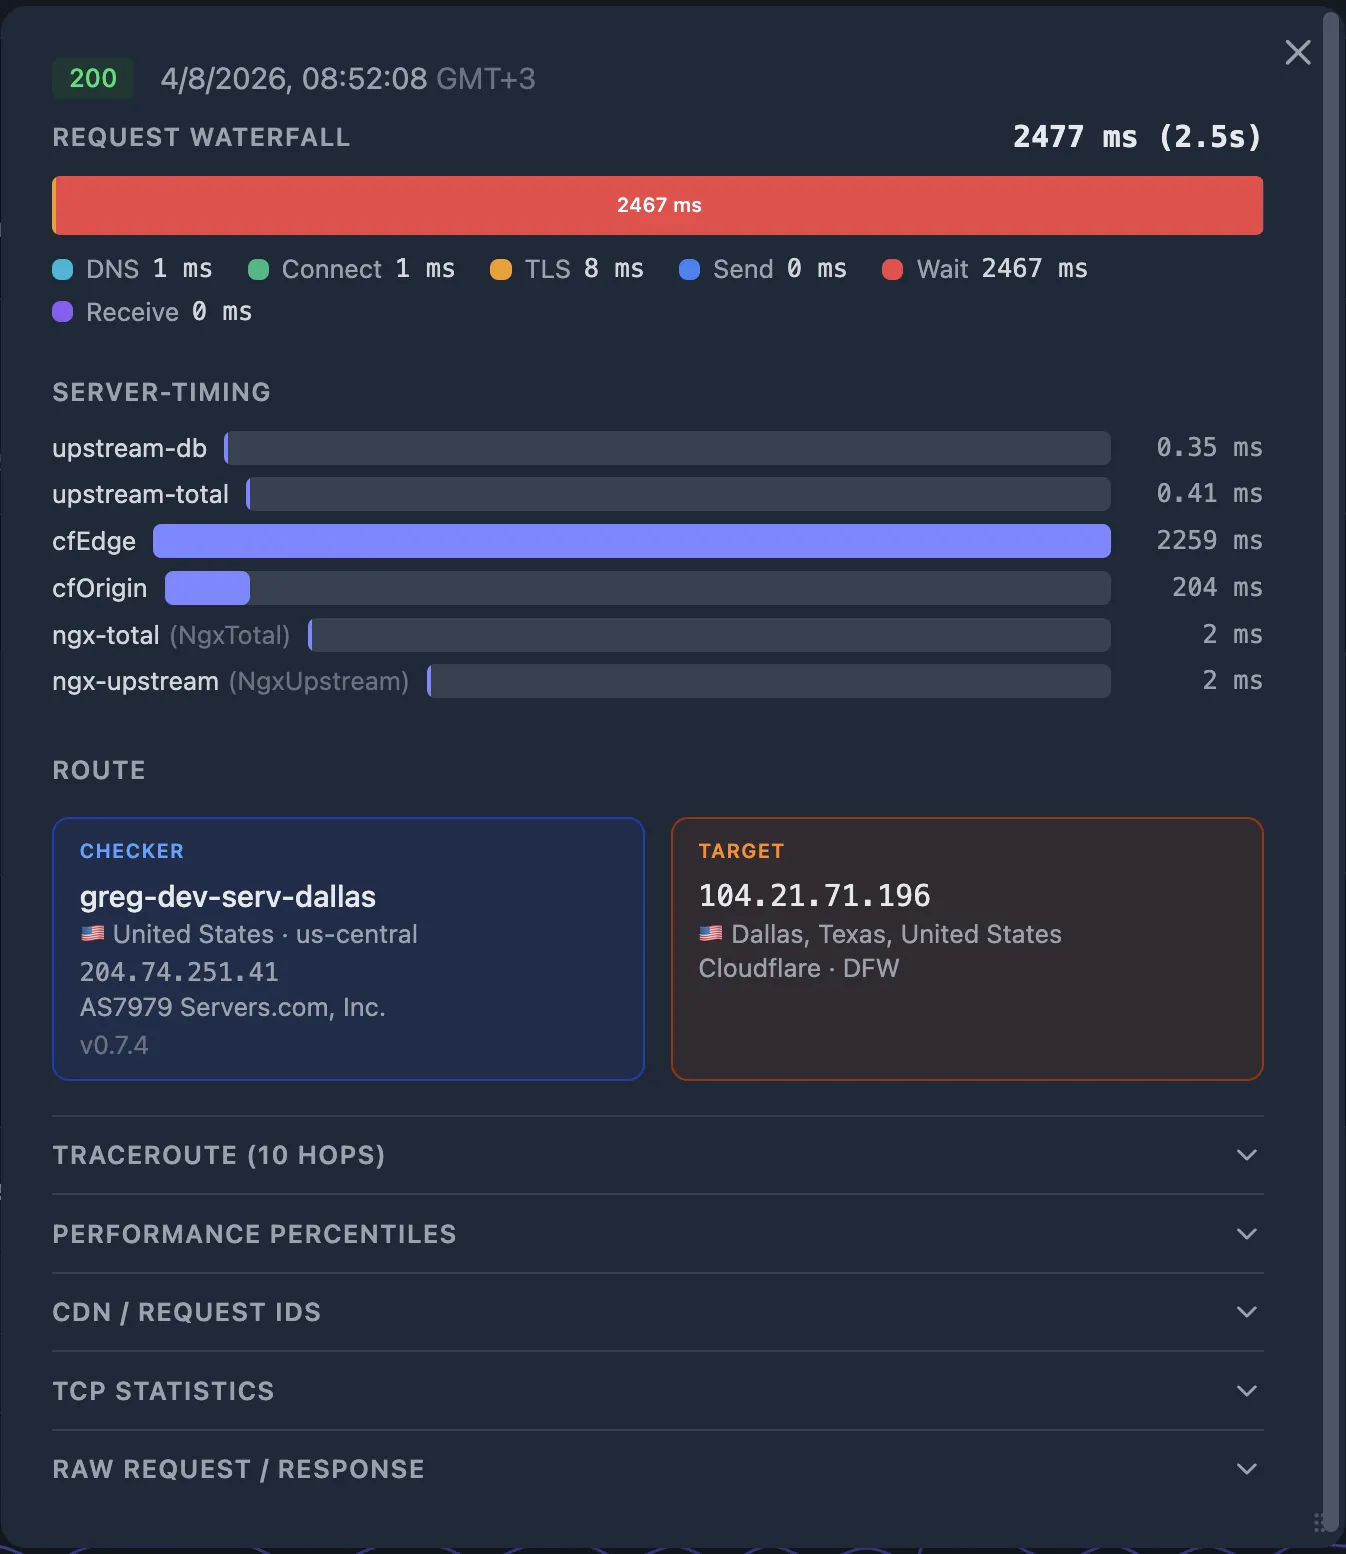
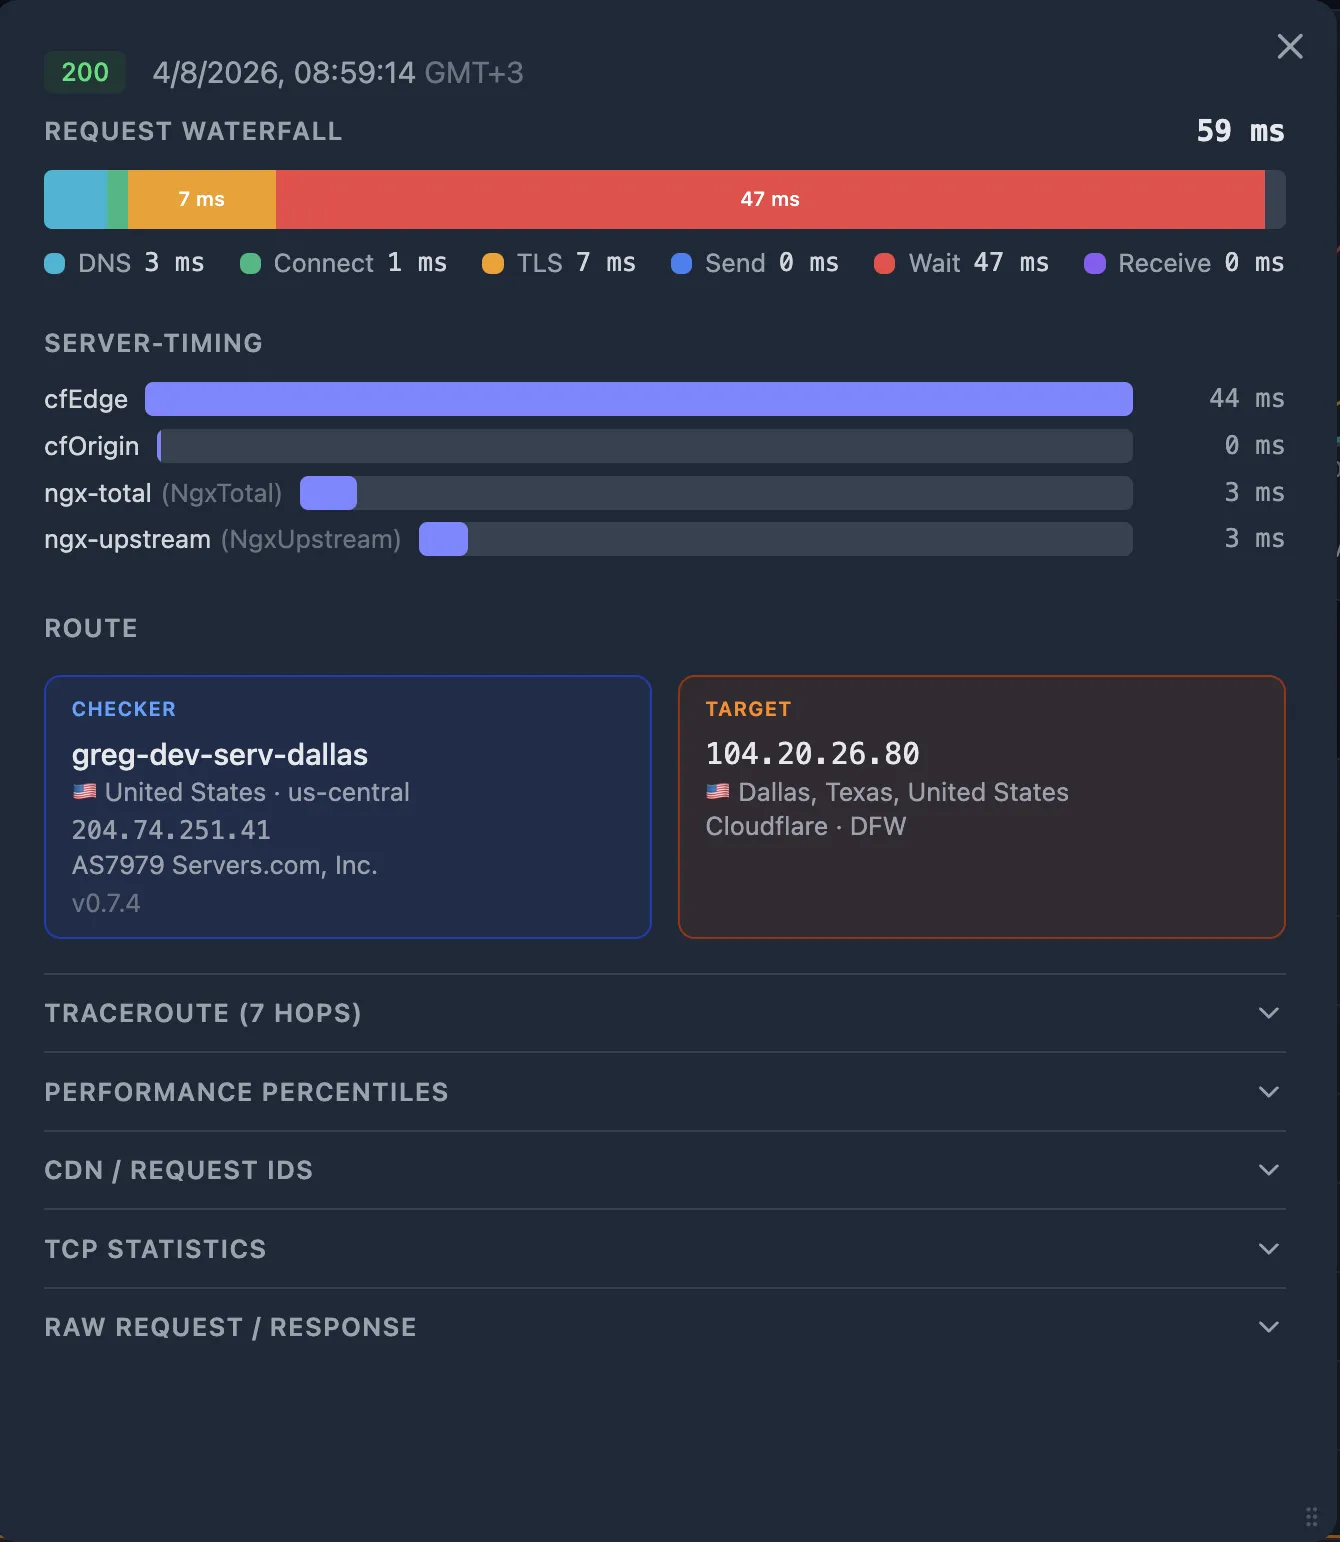
If your SLB injects Server-Timing headers (e.g. Server-Timing: upstream;dur=45), Oack captures and displays them automatically on the probe detail popup.
$upstream_response_time with $request_time (or with the probe's total_ms).
- → Upstream time is large (close to total time) — the bottleneck is to the right of the SLB: App, Connection Pooler, or RDBMS. Go to Step 3.
- ← Upstream time is normal (close to median) — the bottleneck is to the left of the SLB: the network path between User and CDN, or the CDN itself. Go to Step 4.
Step 3 — Upstream is slow: investigate App → DB
You've established that the SLB waited a long time for the upstream. Ideally, this part of the diagram — App, Connection Pooler, RDBMS — should be covered by an APM (Application Performance Monitoring) tool. Oack is not an APM — it monitors from the outside.
But if you don't have an APM set up yet, external monitoring can still help you narrow things down. The Server-Timing HTTP header is a lightweight way to surface internal timing from your application without a full APM deployment — and Oack captures it automatically.
3a. Read application-level Server-Timing
If your application emits Server-Timing headers, Oack captures them automatically.
A well-instrumented app reports individual durations for each backend operation:
Server-Timing: app;dur=120, db;dur=95, pool-wait;dur=18In this example, the app took 120 ms total, of which 95 ms was the database query and 18 ms was waiting for a connection from the pool. Oack renders these as visual bars on the probe detail popup, aligned with the HTTP waterfall so you can see the proportions at a glance.
Server-Timing to your app is straightforward.
Set the header with name/duration pairs for the operations you want to track — database queries, cache lookups, external API calls, connection pool waits.
See the W3C Server Timing spec for the full syntax.
3b. Common upstream culprits
| Signal | Likely cause |
|---|---|
db;dur dominates | Slow query, missing index, table lock, or RDBMS resource exhaustion. |
pool-wait;dur is high | Connection pooler saturated — all connections busy, new requests queue. Check PgBouncer pool size or app connection limits. |
app;dur is high, db;dur is low | Application-level bottleneck — CPU-intensive computation, blocking I/O, or memory pressure. |
502 or 504 from SLB | Upstream crashed (502 Bad Gateway) or timed out (504 Gateway Timeout). Check app logs and process health. |
If your app doesn't emit Server-Timing headers yet, the SLB's $upstream_response_time still tells you the problem is behind the SLB — use your APM (if you have one), application logs, or database slow query log to narrow it down further.
Either way, adding Server-Timing headers to your app is a quick win: it gives you per-operation visibility through any external monitor — no APM required, no vendor lock-in, just a standard HTTP header.
Step 4 — Upstream is fine: investigate User → CDN → SLB
The SLB reports normal upstream times, so the problem is to its left. Now use the probe's HTTP timing breakdown to figure out where between the User and the SLB.
4a. Check the HTTP timing fractions
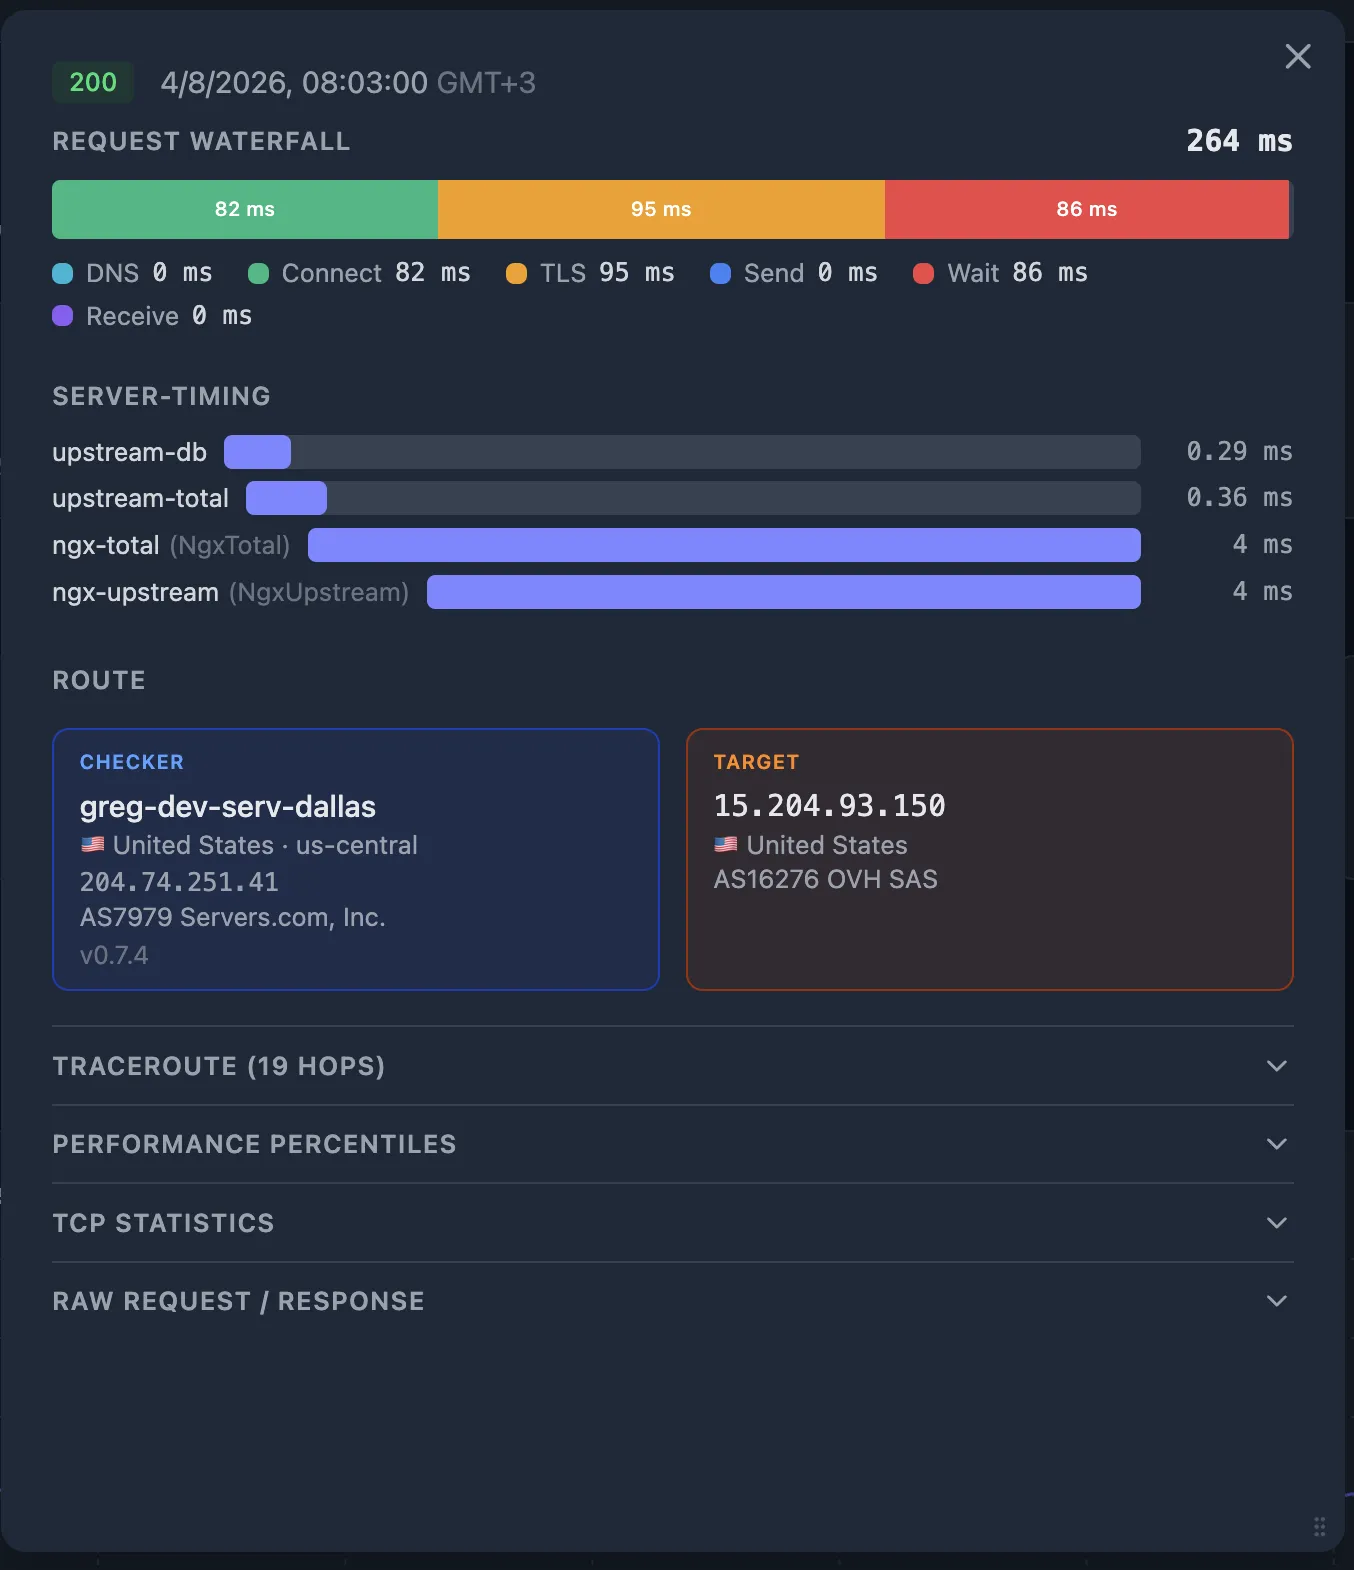
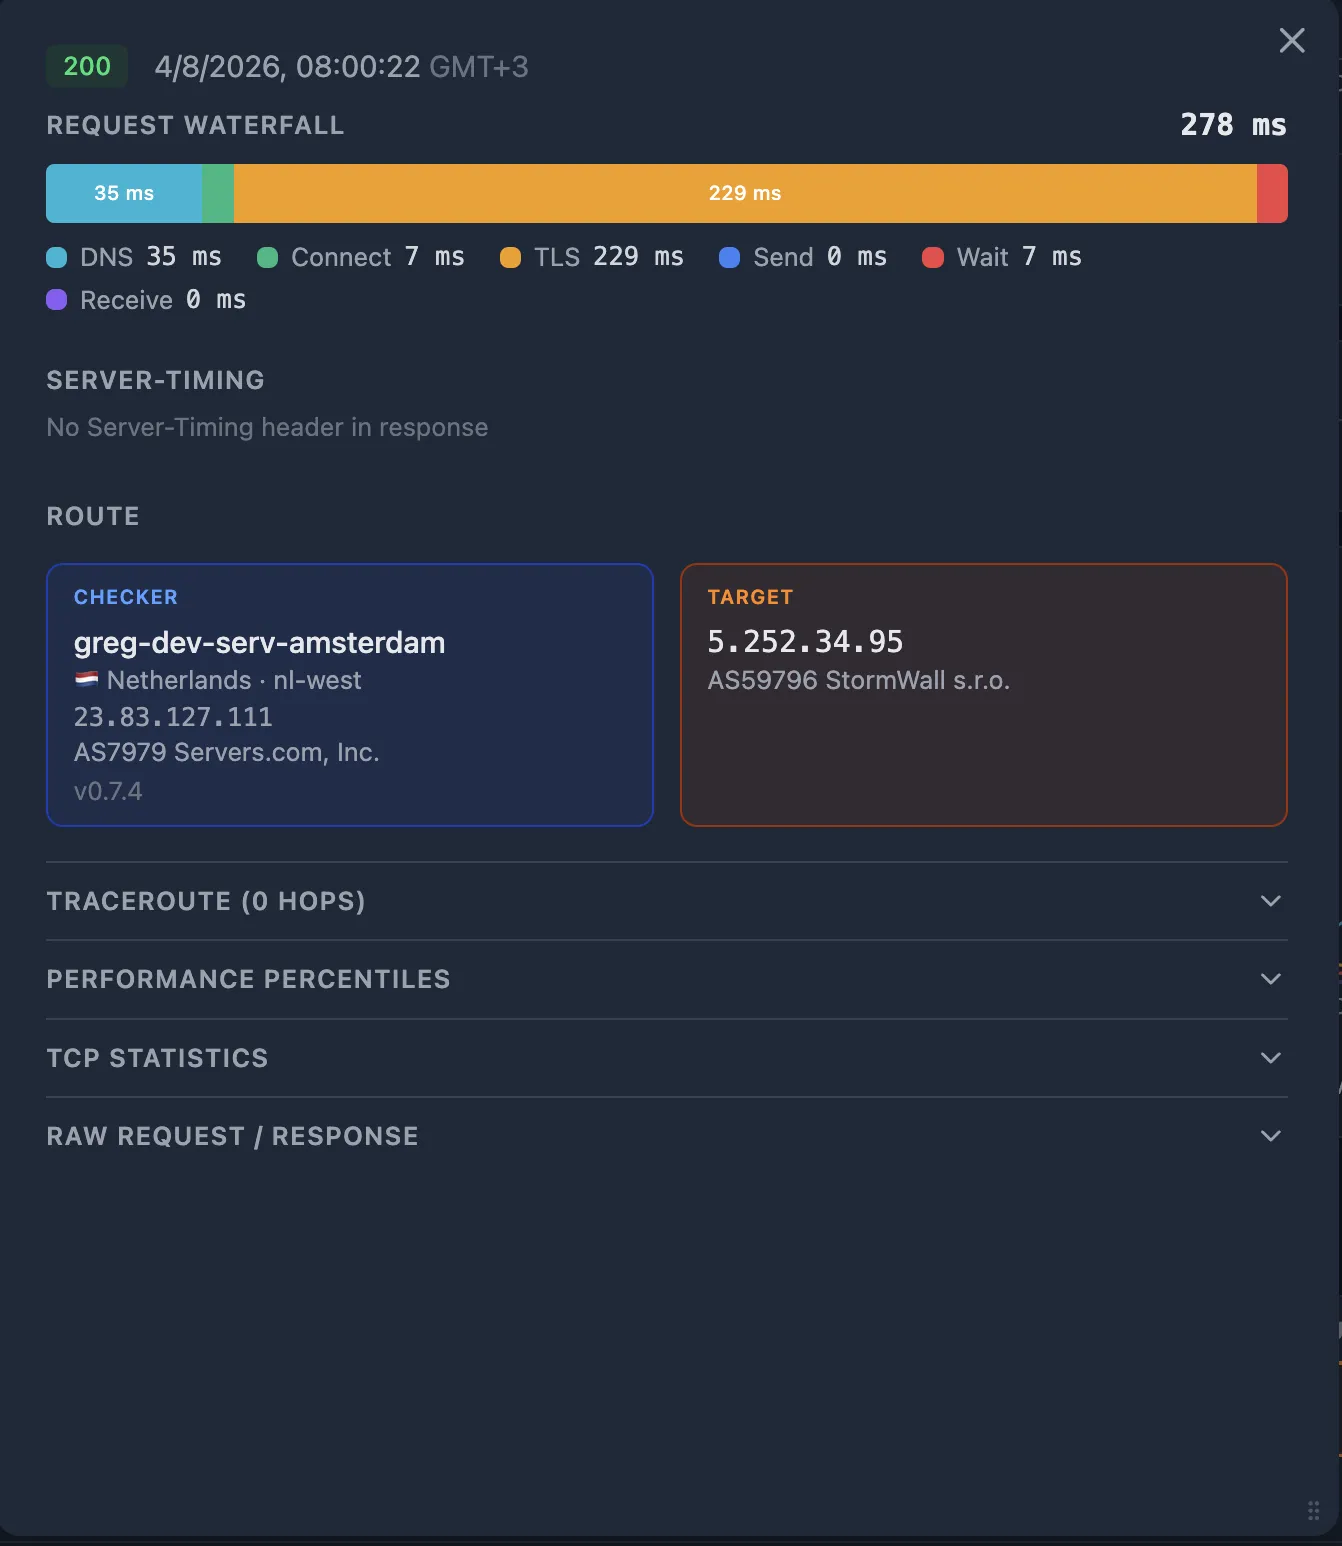
Look at the Request Waterfall on the probe detail popup. Each fraction tells you about a specific segment of the path:
| Fraction | Large value suggests | Segment |
|---|---|---|
dns_ms | Slow or failing DNS resolver | User → DNS |
connect_ms | High network latency or routing issue to the nearest edge | User → CDN PoP |
tls_ms | Certificate chain issues, no TLS session resumption, or latency amplified by multiple round trips | User ↔ CDN PoP |
wait_ms | Time to first byte — if connect_ms and tls_ms are small, this is CDN edge processing or CDN-to-origin fetch time | CDN → SLB → App |
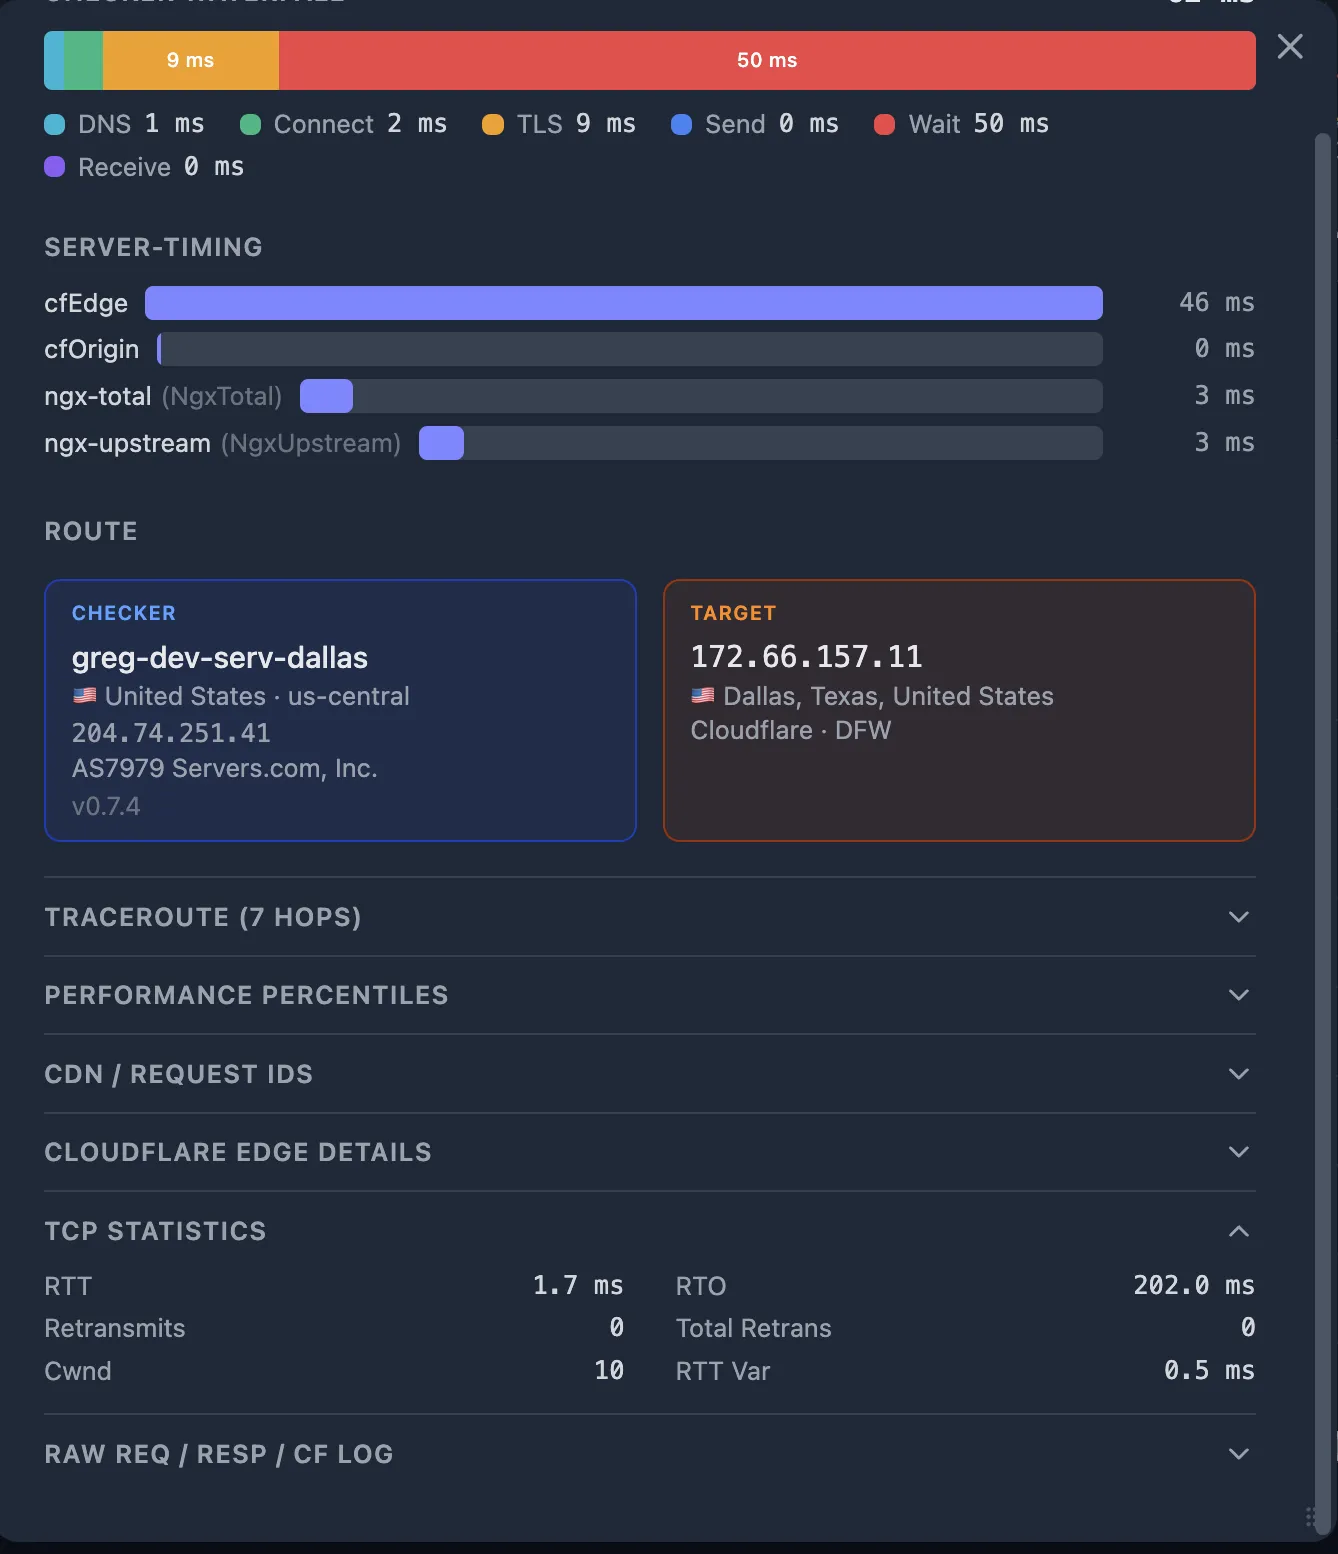
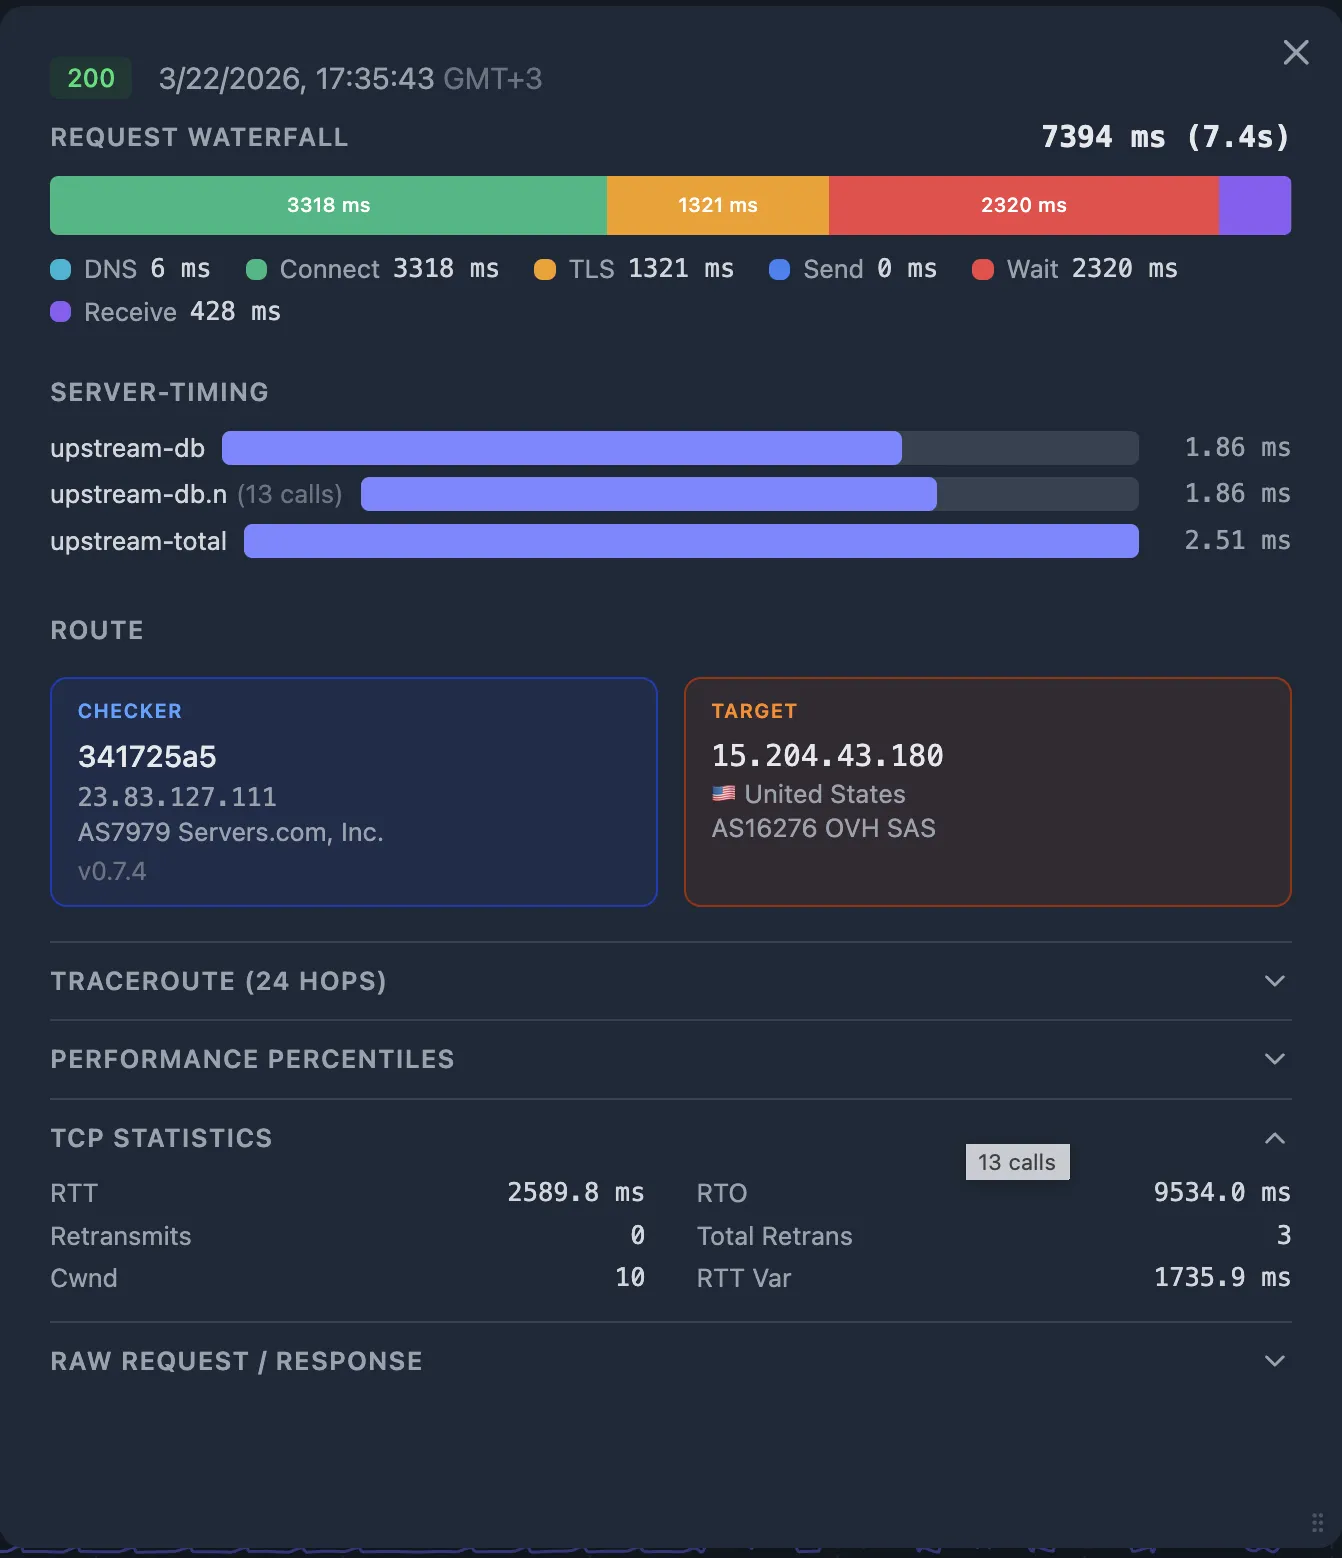
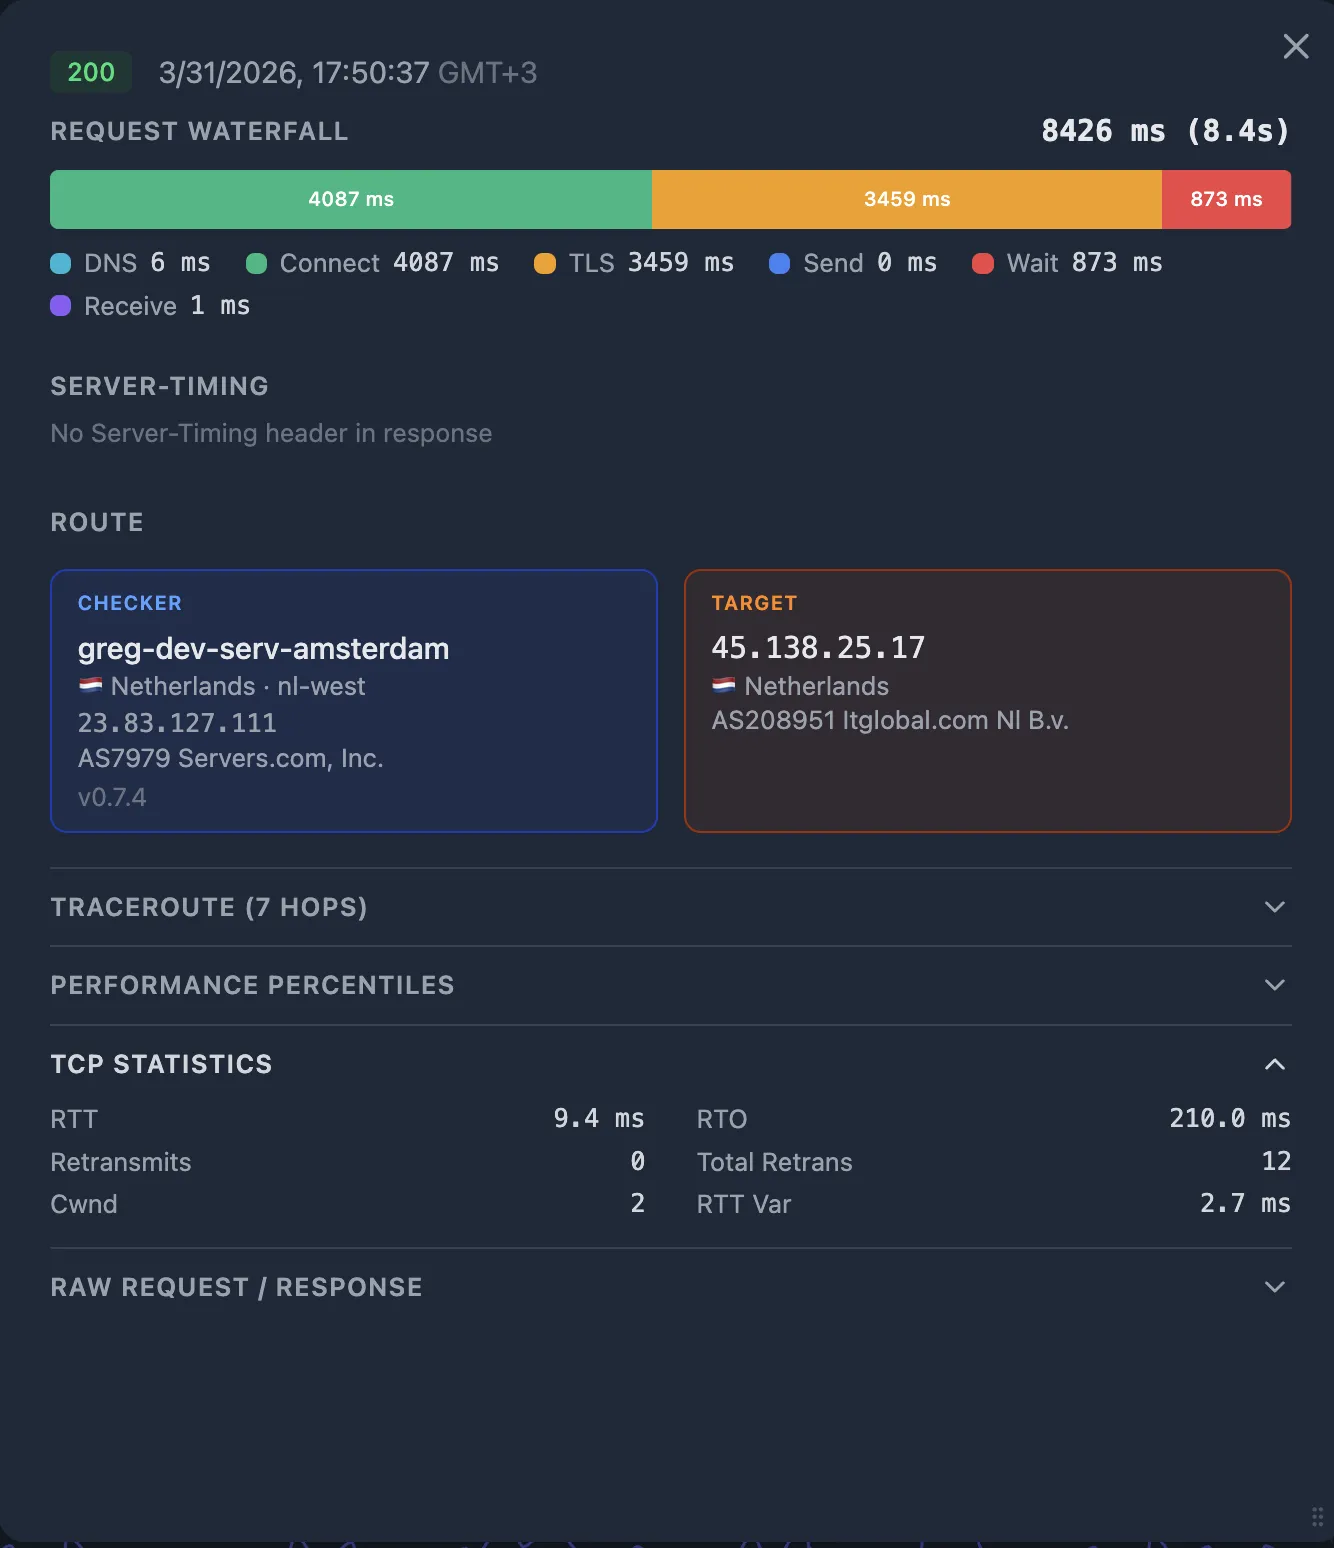
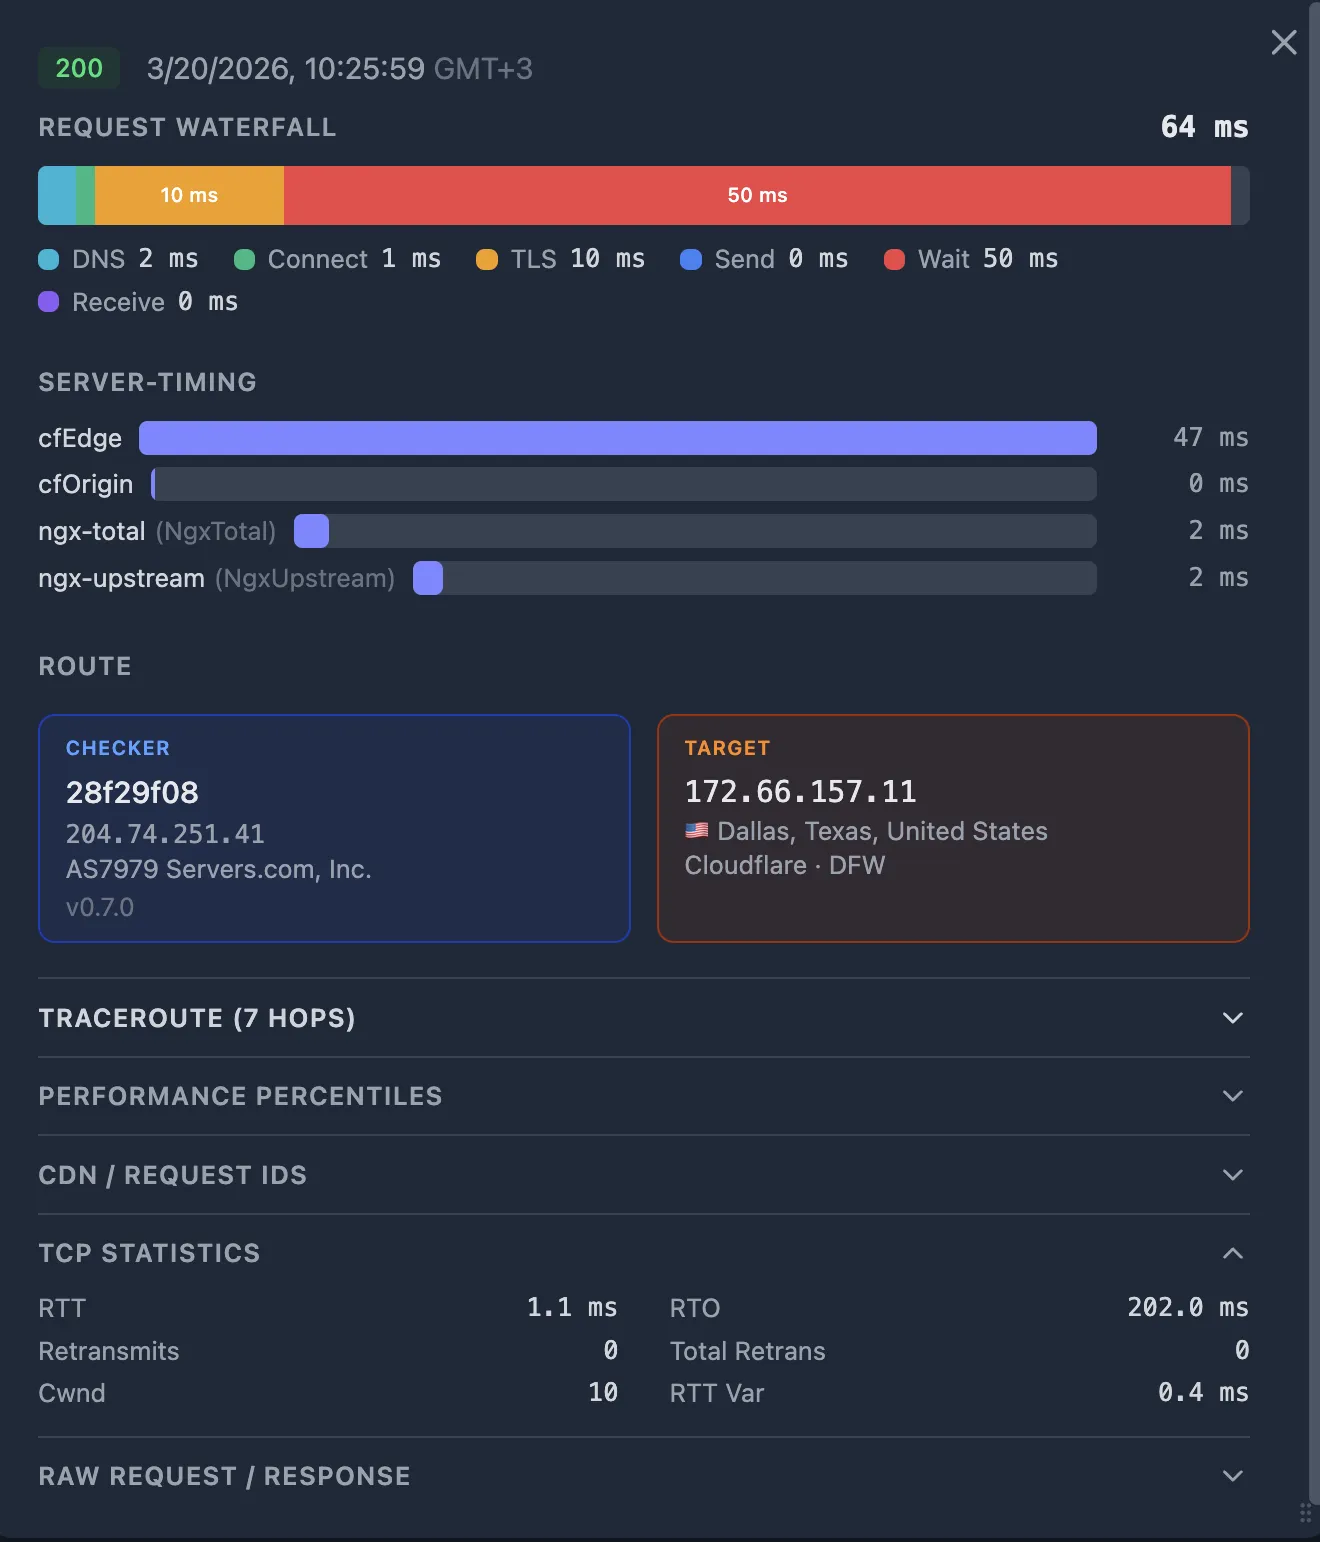
4b. Cross-reference with TCP telemetry
The HTTP fractions tell you what's slow. The TCP metrics tell you why:
- High RTT — the network path itself is slow (geographic distance, congested peering, bad routing).
- Retransmits > 0 — packet loss on the path. Even one retransmit adds a full RTO (often 200 ms+) of delay.
- Collapsed congestion window (
cwnd) — the kernel detected loss and is throttling sends. Correlates with elevatedreceive_ms.
If connect_ms and tls_ms are large and RTT is high — this is a network issue between the User (checker) and the CDN PoP.
If connect_ms and tls_ms are small but wait_ms is large — the problem is at the CDN edge or between the CDN and your origin. Go to Step 5.
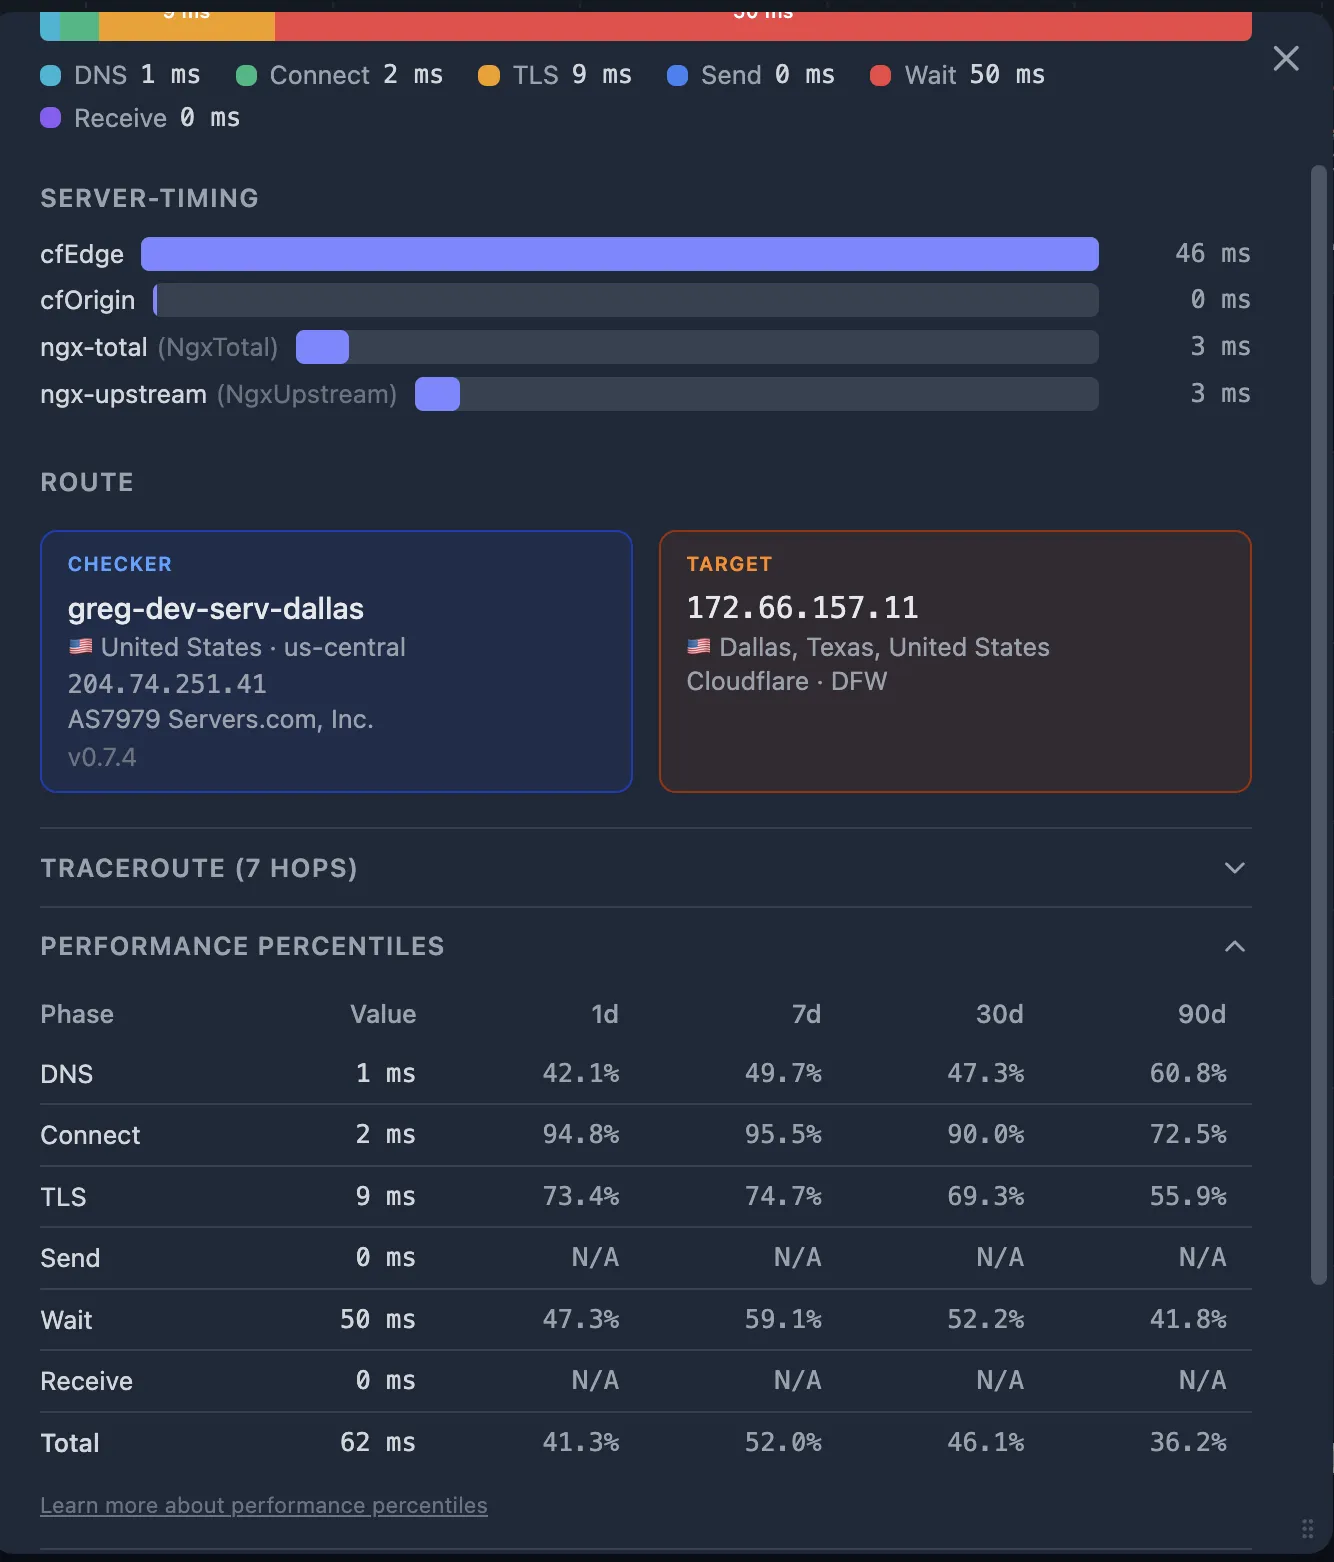
Step 5 — Use Percentiles to confirm the anomaly
Before chasing a root cause, confirm that the current values are actually abnormal. Open the Performance Percentiles table on the probe detail popup. For each timing fraction, you see the current value and its percentile rank across four time windows.
| Fraction | Value | 1d | 7d | 30d | 90d |
|---|---|---|---|---|---|
| dns_ms | 3 ms | 42% | 38% | 38% | 38% |
| connect_ms | 180 ms | 96% | 97% | 97% | 97% |
| tls_ms | 420 ms | 94% | 95% | 95% | 95% |
| wait_ms | 85 ms | 55% | 52% | 52% | 52% |
| total_ms | 690 ms | 88% | 91% | 91% | 91% |
How to read this: connect_ms at the 97th percentile means 97% of probes over the last 7 days had a faster TCP handshake — this is a clear outlier.
Meanwhile, wait_ms at 52% is perfectly normal — don't chase it.
The pattern here (high connect_ms + high tls_ms + normal wait_ms) points to a network issue between the checker and the CDN edge — not a server-side problem.
Step 6 — Inspect CDN Server-Timing and edge logs
If the problem is at the CDN layer (normal connect_ms / tls_ms but elevated wait_ms, and the SLB reports fast upstream), dig into the CDN's own timing data.
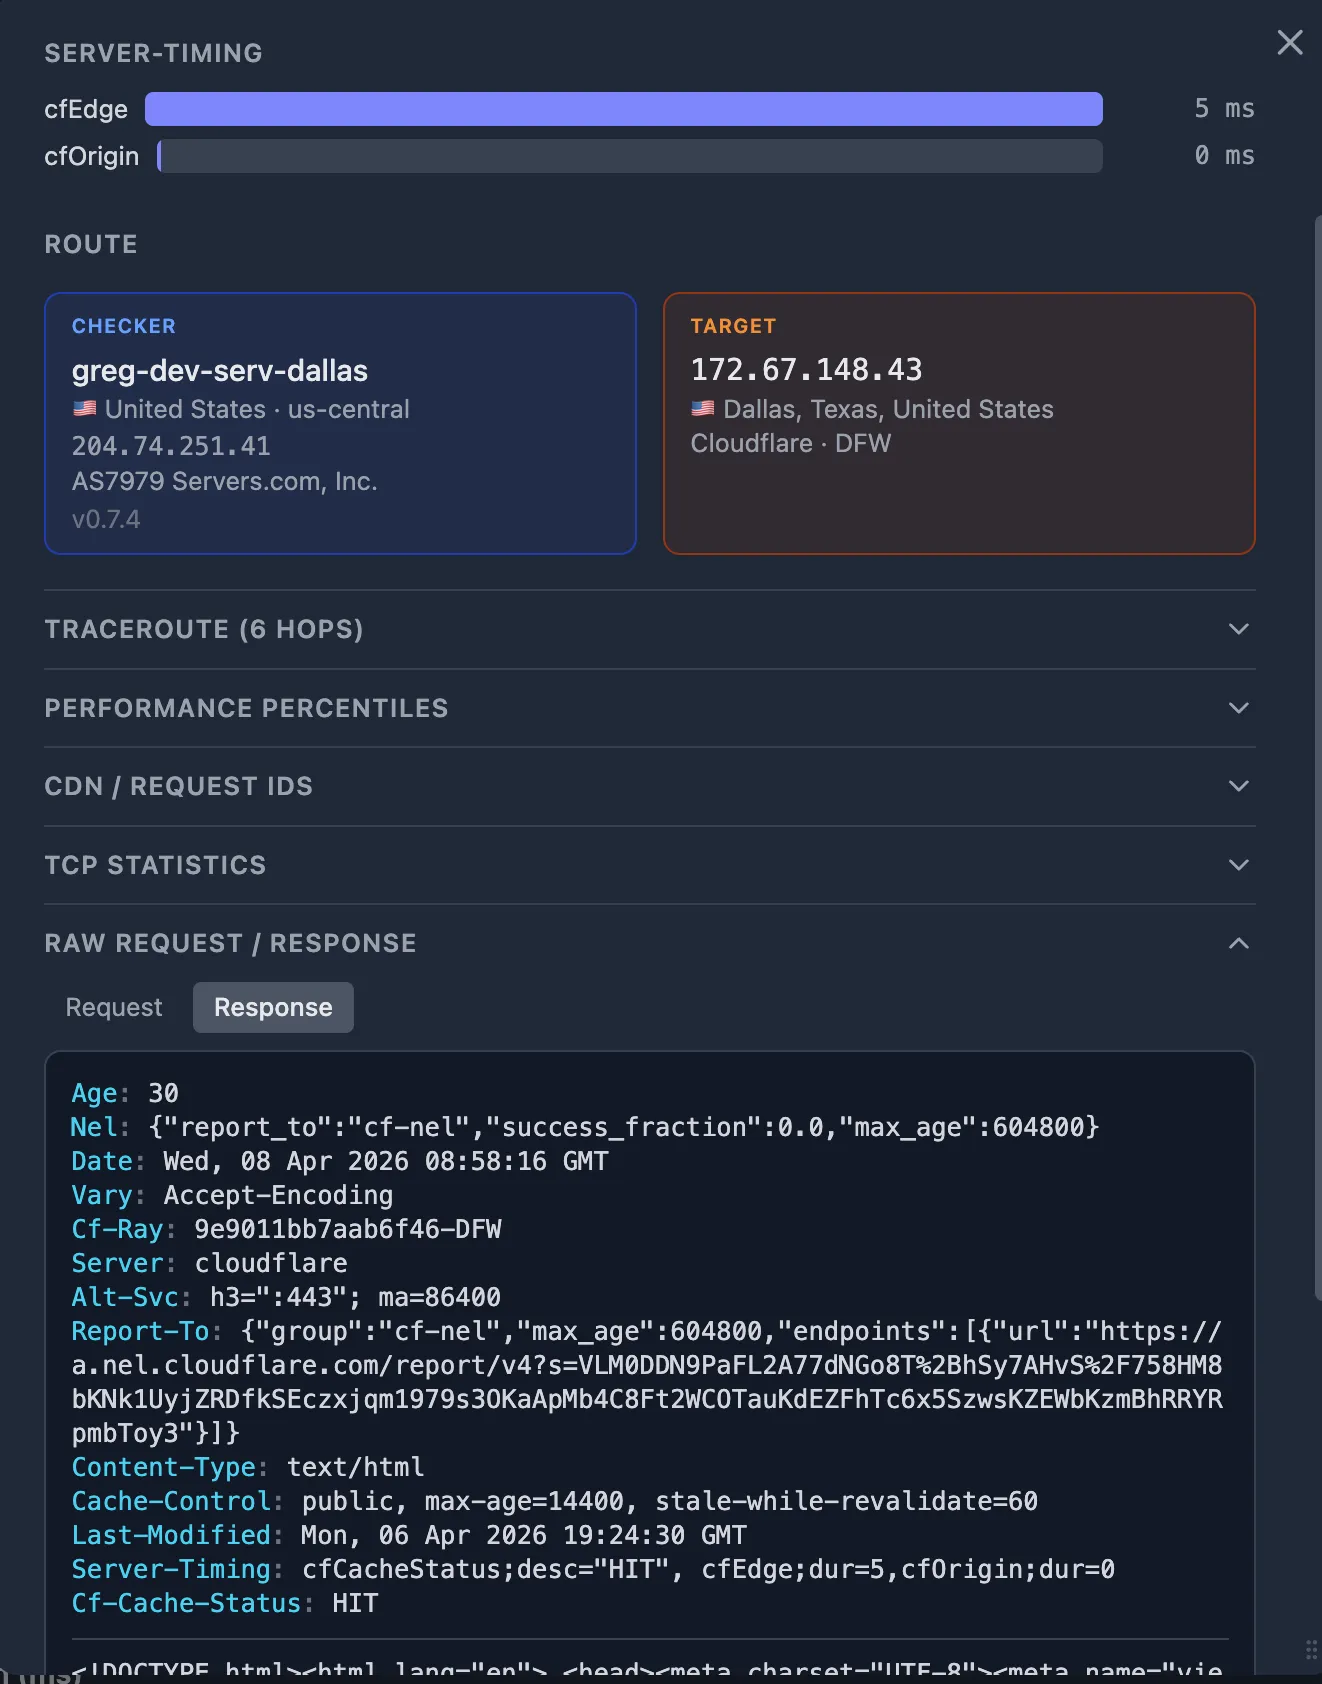
6a. CDN Server-Timing header
Cloudflare includes a Server-Timing header on responses.
Oack captures it automatically. Look for:
Server-Timing: cfL4;dur=32
The cfL4;dur value is Cloudflare's Layer 4 processing time.
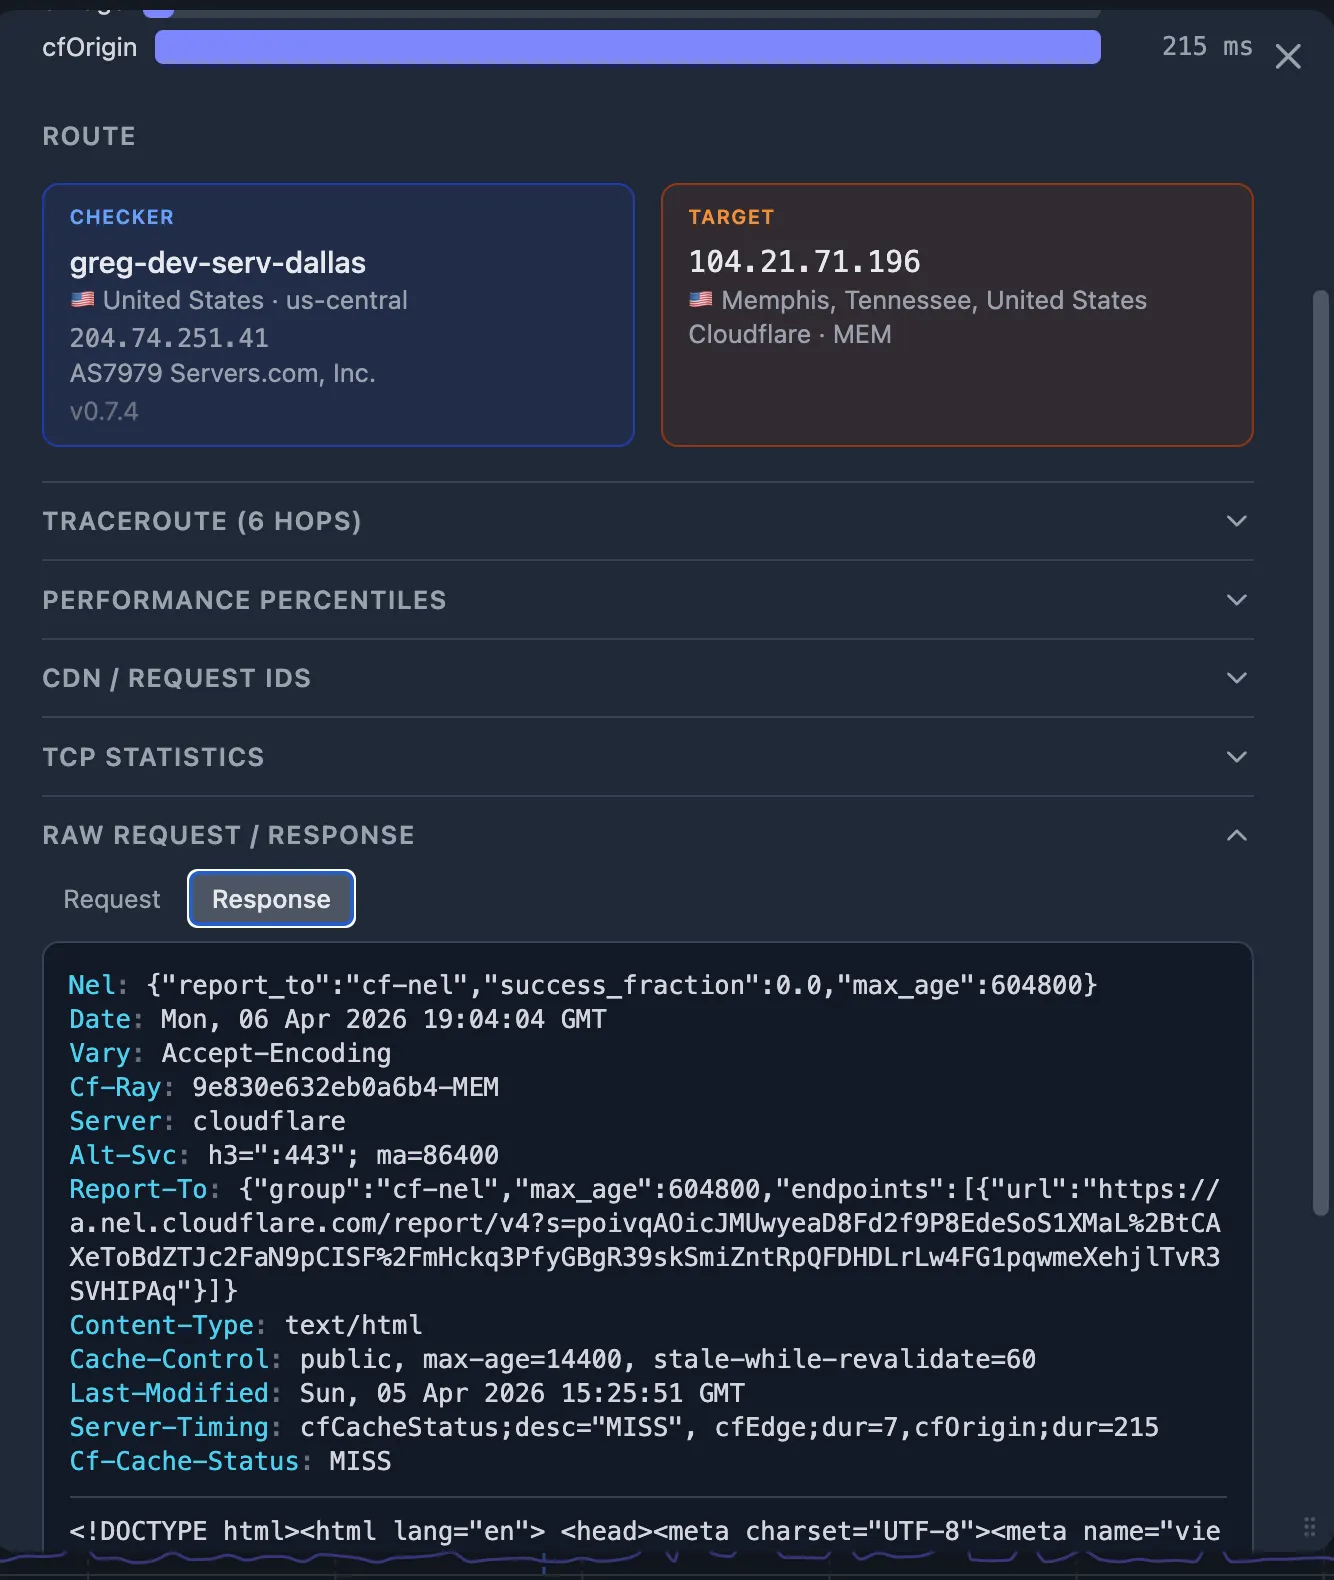
Compare it with the probe's wait_ms:
if cfL4;dur is small but wait_ms is large, the time is spent on the CDN-to-origin fetch (cache MISS) or CDN edge compute (WAF, bot detection, Workers).
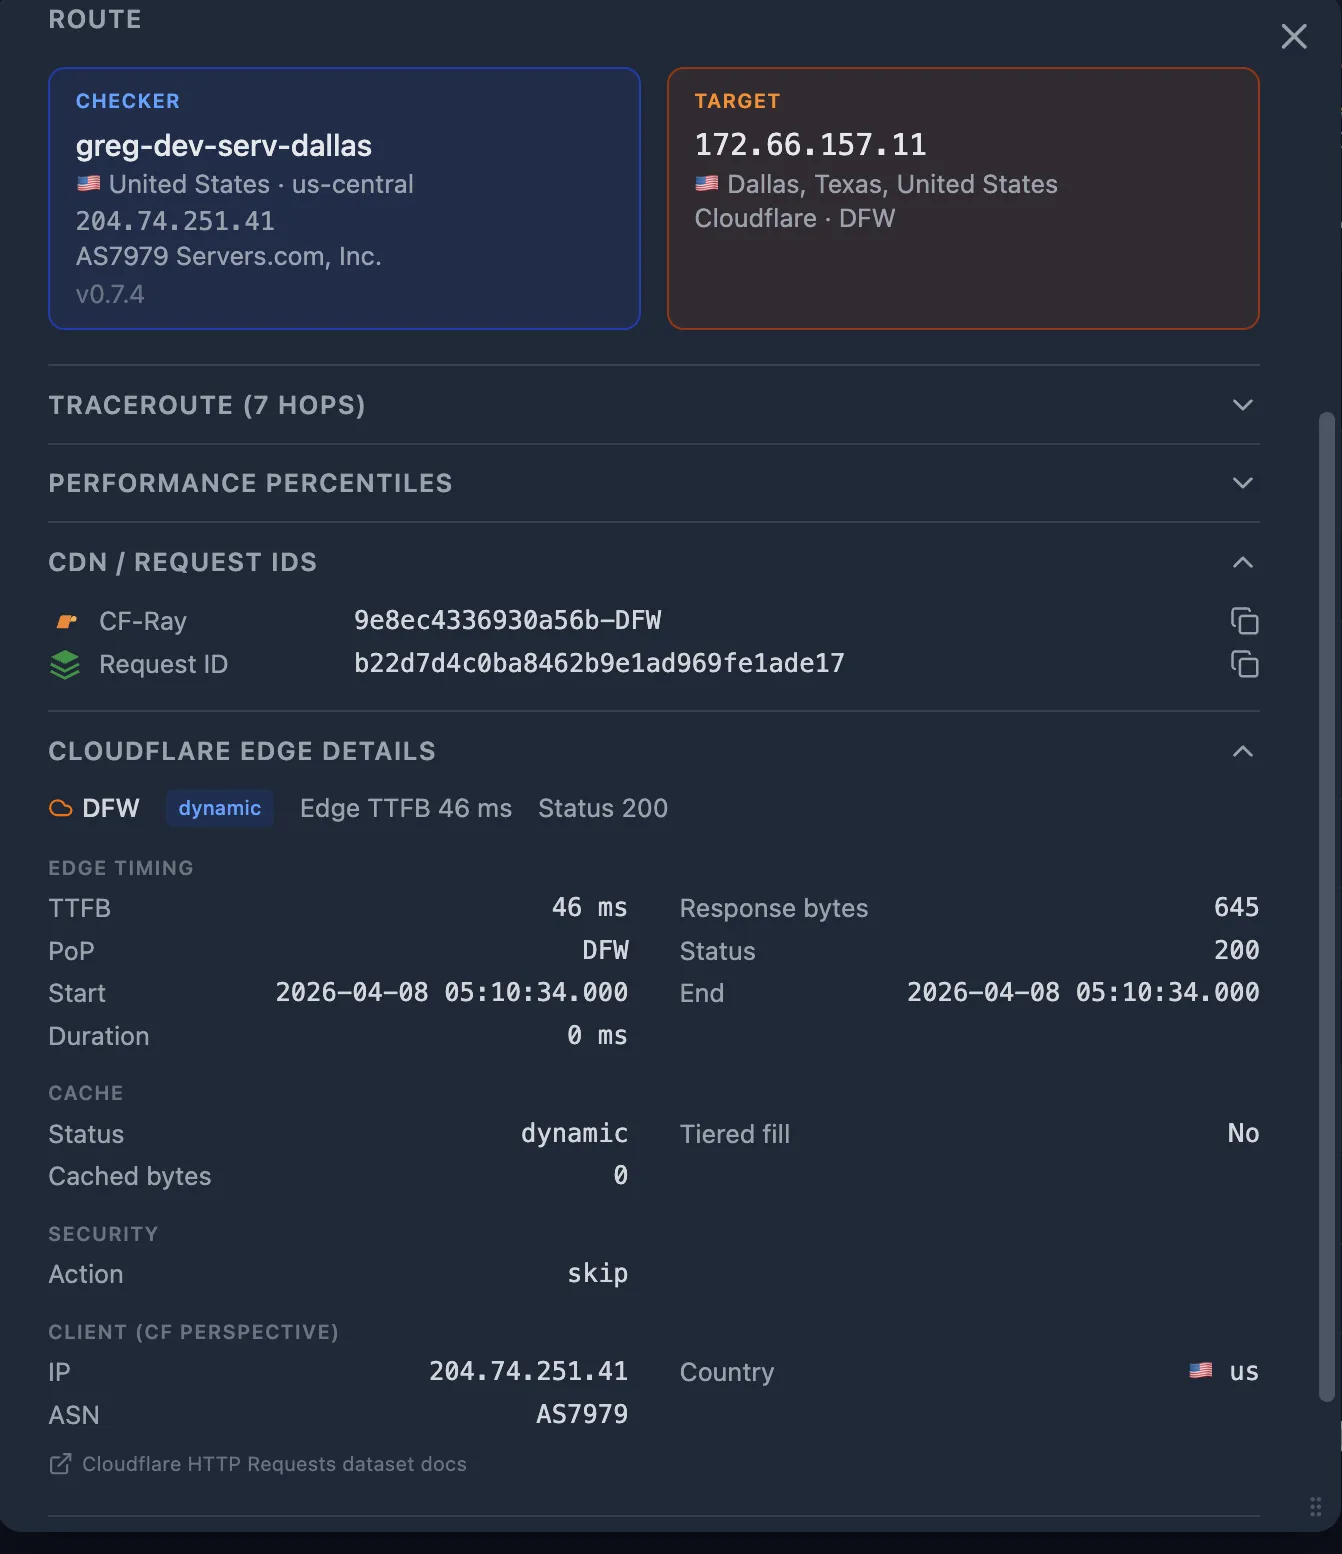
6b. CDN edge logs (Cloudflare Instant Logs)
If you have CDN Enrichment configured, each probe is enriched with the Cloudflare edge log entry. The edge log contains:
- Cache status —
HIT,MISS,DYNAMIC,EXPIRED. AMISSmeans the CDN fetched from origin — the CDN-to-origin path may be slower than the User-to-CDN path. - Origin response time — how long the CDN waited for your origin to respond.
- Edge PoP — which data center handled the request.

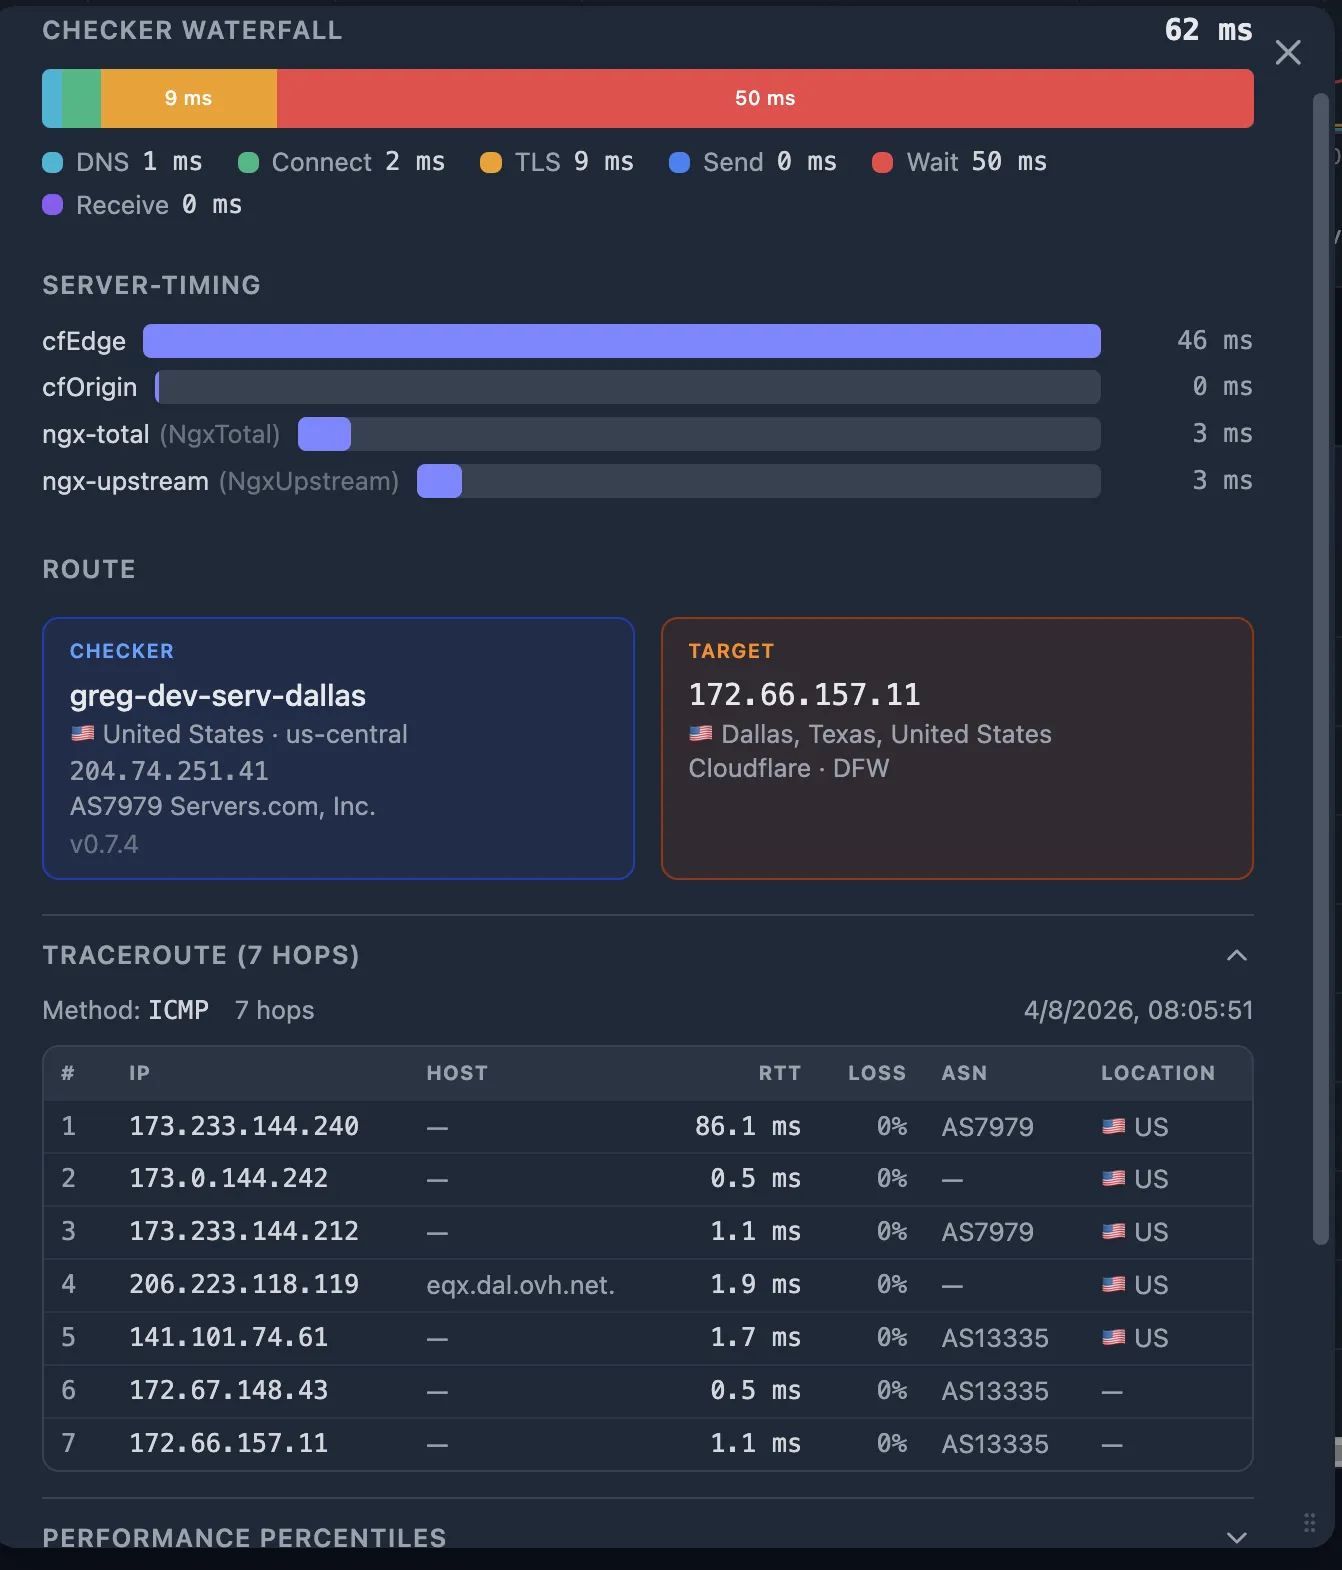
Step 7 — Compare PoPs and traceroutes: good vs. bad
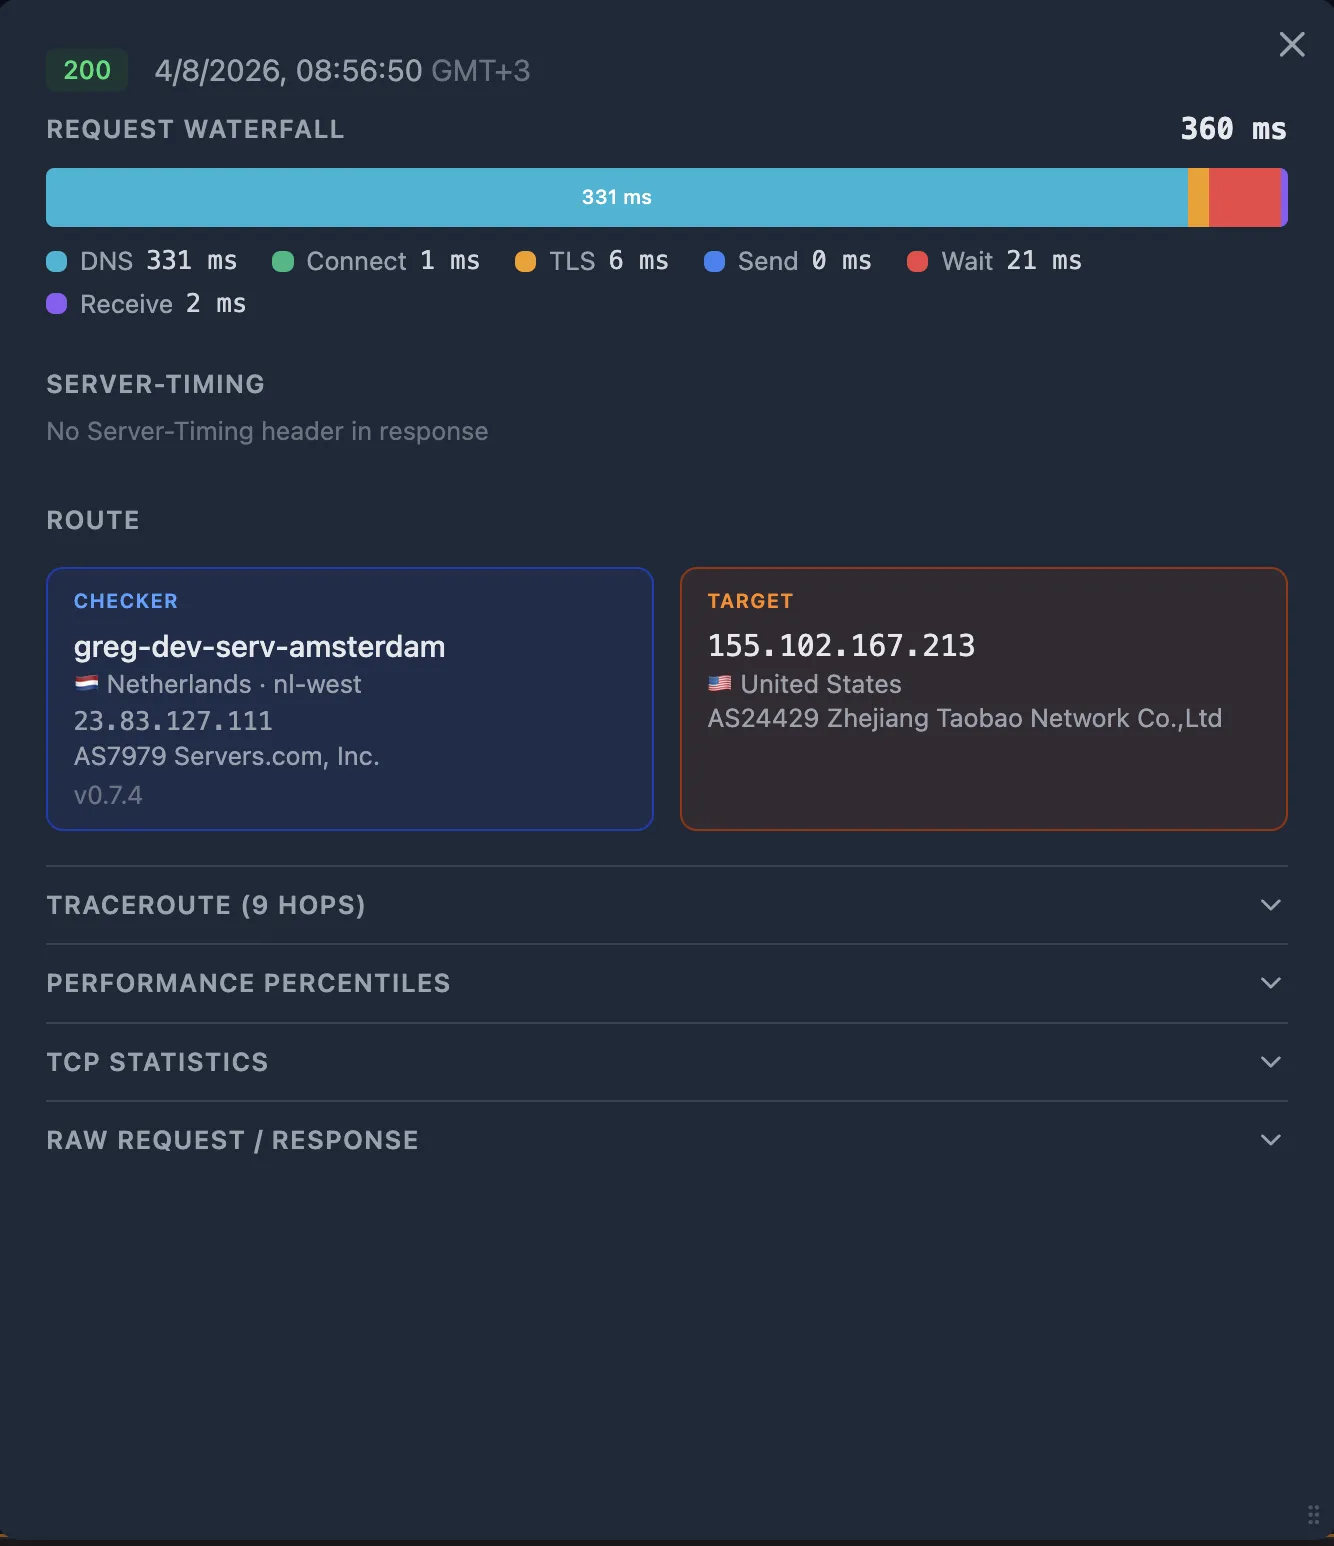
The probe detail popup shows both the CDN GEO (which edge PoP served the request) and the Traceroute (the network hops from checker to target). Compare a good probe (normal latency) with the bad probe (the one that triggered the alert):
| Signal | Good probe | Bad probe |
|---|---|---|
| CDN PoP | FRA (Frankfurt) | IAD (Virginia) |
| Traceroute hops | 5 hops, 8 ms avg RTT | 12 hops, 120 ms avg RTT |
| connect_ms | 12 ms | 180 ms |
In this example, the bad probe was routed to a distant CDN PoP (Virginia instead of Frankfurt for a European checker), adding 120 ms+ of round-trip latency. This is a CDN geographic routing issue — the CDN's anycast routing sent the request to a suboptimal edge.
Step 8 — Isolate the CDN-to-origin segment
Sometimes everything looks clear both before the CDN (User → CDN is fast) and after the CDN (SLB says upstream is fast) — but the total latency is still high. Even though the CDN might be a black box, you've narrowed the problem to the segment between the CDN edge and your hosting provider.
8a. Use an alternative CDN as a diagnostic tool
Create a second HTTP monitor that hits the same origin through a different CDN (or directly, bypassing the CDN). Use a CDN with pay-as-you-go billing to keep costs minimal — you only need it as a diagnostic probe, not for production traffic.
- Both monitors show issues — the problem is likely at your hosting provider or origin infrastructure. Open a support ticket with your hosting provider, including the probe details and traceroutes from both monitors.
- Only the primary CDN monitor shows issues — the problem is specific to that CDN. Contact their support with the CDN PoP codes, traceroutes, and probe timestamps from the bad probes.
8b. Check the CDN status page
CDN providers publish incident and maintenance information on their status pages. Cross-reference the PoP code from the bad probe's CDN GEO data with the status page — if that PoP is listed as degraded, you've found your answer without further investigation.
Quick reference: the decision flowchart
Here's the full diagnostic path in summary:
| # | Check | If yes | If no |
|---|---|---|---|
| 1 | SLB upstream time is large? | Problem is right of SLB → Step 3 | Problem is left of SLB → Step 4 |
| 2 | connect_ms or tls_ms elevated? | Network issue User ↔ CDN → check TCP metrics, traceroute | CDN or CDN ↔ origin issue → Step 6 |
| 3 | CDN PoP changed vs. good probe? | Geographic routing issue → check CDN status page | CDN-to-origin segment → Step 8 |
| 4 | Both CDN monitors affected? | Hosting provider issue → open support ticket | CDN-specific issue → contact CDN support |
| 5 | App Server-Timing shows high db;dur? | Database bottleneck → check slow query log | App-level issue → check APM / app logs |
What's Next
- Set up CDN Enrichment to get Cloudflare edge logs on every probe automatically.
- Add
Server-Timingheaders to your application and SLB — see the W3C Server Timing spec. - Understand how Performance Percentiles work to quickly spot anomalies.
- Learn about TCP Telemetry and how kernel-level metrics complement HTTP timing.
- Use the MCP server to let an AI agent walk through this decision tree automatically.
- Share probe details with your team or CDN support using Probe Sharing.